Originally posted: 2025-11-18. View source code for this page here.
One of the biggest challenges of data linkage and deduplication is that we rarely have labelled (ground truth) data, which makes it hard to measure how the model is performing.
This article explores some of the challenges of measuring accuracy, and the best way to approach the problem.
In summary, I am generally suspicious of precise accuracy metrics in record linkage. That's not to say they're not useful - they should just be treated with caution and understood as rough estimates at best.
To determine whether a model is suitable for a given application, I believe it is at least as important to develop a qualitative understanding of the model and of the scenarios in which the record linkage may fail.
Accuracy metrics often use labels that have been generated by humans (clerical review). In my experience these are often unreliable.
The reason is that it is usually not possible to precisely label record pairs by looking at the data alone. Instead, it may require time consuming activities like contacting individuals, but this is usually cost prohibitive.
To see why this is the case, imagine you're a human who's been asked to label the following record pair, and make a judgement about whether they relate to the same person:
| first name | surname | dob | city |
|---|---|---|---|
| John | Smith | 1950-01-02 | London |
| John | Smith | 1950-01-02 | London |
It is unclear what a labeller should do. They might be the same person, but, by reference to this data alone, they can't be certain either way. There could easily be two John Smiths born on the same day in London.
They may proceed by looking at some statistics: how common the name "John Smith" is in London, and how many people are born on average each day, to estimate the probability of two different people sharing these attributes.
However, this doesn't really help because:
- It will result in a probability, not a certain answer1
- This calculation is little different to what a record linkage model would do anyway, so it's unclear what value the human is adding
A second problem is that it is difficult to define the task the human should be doing. Often, the argument for two records matching may rely on a third record, as in the following example, where we imagine someone's surname has changed through marriage:
| record_id | first name | surname | dob | city |
|---|---|---|---|---|
| A | Mary | Smith | 1999-02-03 | Leeds |
| B | Mary | Smith-Jones | 1999-02-03 | Leeds |
| C | Mary | Jones | 1999-02-03 | Leeds |
A human labeller presented with records A and C alone would probably conclude they are different people, but when shown record B, they may change their mind.
The problem is that building an effective labelling interface that allows such transitive judgements is almost impossible, so labelling often proceeds on a pairwise basis.
One possible solution to the lack of labelled data would be to test a record linkage model on synthetic data, where records have been deliberately duplicated and corrupted so that the ground truth is known for sure.
The problem here is that the results are only as good as the synthetic data, and it's extremely difficult to generate realistic synthetic data. In the real world, there are complex correlations between each field in your dataset and in the error generating mechanism across fields. It is hard to measure these correlations without a ground truth, and even if they are known, it is even harder to write code that generates synthetic data that conforms to these correlations2. For more, see here and here.
Record linkage models usually take a pair of records as an input and output a match score. It seems natural therefore to collect labels on a pairwise basis, and measure the accuracy by comparing the model's prediction to the pairwise label.
Unfortunately this can lead to a misleading picture of accuracy, because the ultimate goal of record linkage is often to cluster records together into groups that relate to the same entity.
To understand why consider the following results of a record linkage:
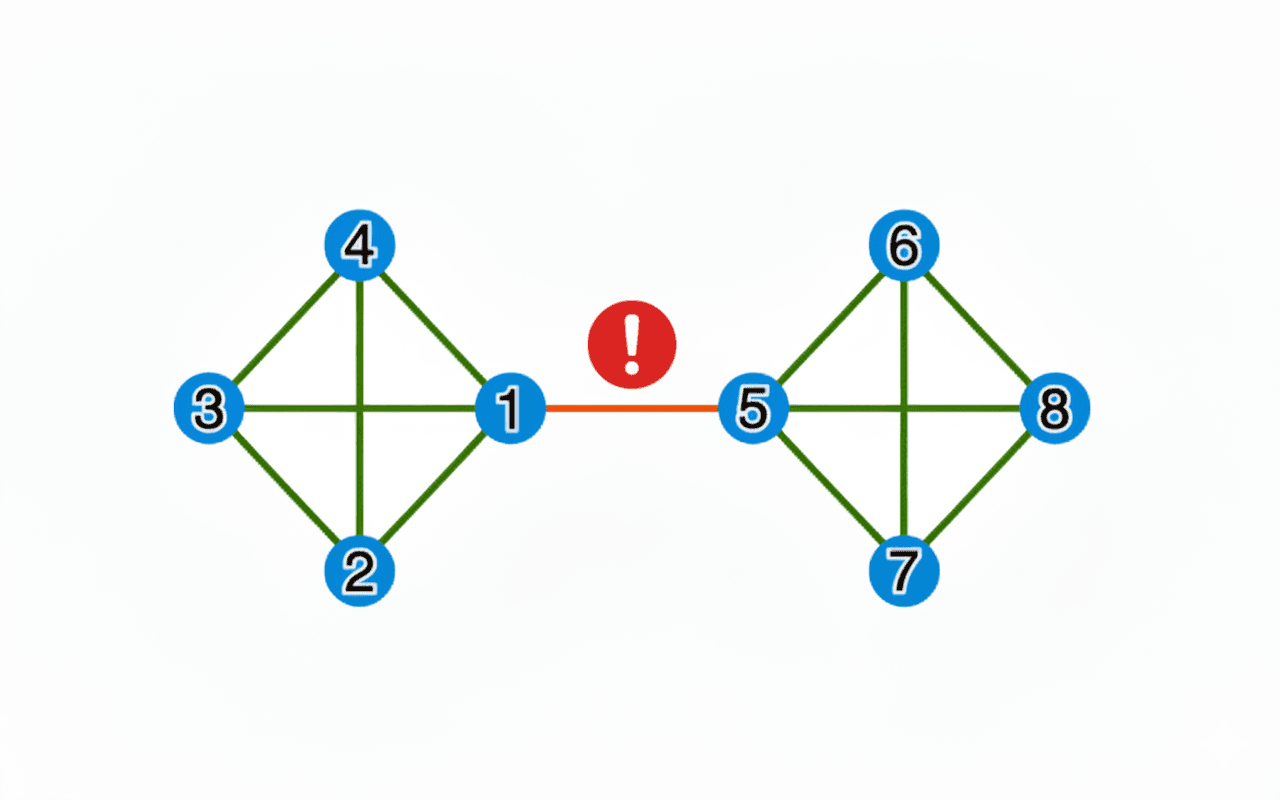
The problem is that a single pairwise misclassification - in the diagram above the link between node 1 and 5 - causes a large number of implicit false positives: all the pairwise links between the two clusters (1,2,3,4) and (5,6,7,8) are now effectively false positives.
This means that whenever there's a clustering step in the record linkage process, we should really be measuring accuracy at the cluster level, not the pairwise level. In order to do this correctly, adjustments are needed to the labelling process. Designing these metrics is not straightforward and makes it more difficult to use standard tools like precision and recall, ROC curves, f1 scores and so on. Luckily there is an open source library called er-evaluation here that implements some of these metrics.
There's no perfect solution to these challenges - but here are some things I've learned from experience that can be combined to a useful approach:
The value of labelling
In my experience, clerical labelling is one of the most useful activities to build confidence in a record linkage model - so long as it's understood that the end goal is not to generate precise accuracy metrics.
This is particularly valuable if the labelling is done by the team who are building the model.
The reason is that it forces the team to look at a large number of real life examples, and to really think about whether the model is doing something sensible, and whether there are any improvements to the model.
It makes it easy to spot things like edge cases, failures in data cleaning code, and so on.
As a result, one of the most important outputs of the exercise is the qualitative understanding of how the model works, as opposed to the accuracy results.
Labelling strategy
I recommend against a random sampling strategy for labelling because it can be very inefficient. Instead, it's important to identify different scenarios for labelling, and get labelling coverage across the most common scenarios. I describe how this strategy can be implemented in Splink in more detail in the annex.
Another downside of a random sample strategy for labelling is that you may well miss edge cases unless the random sample is large.
But you often know in advance what these edge cases may be. And even if not, they can be identified with a bit of human creativity.
Good examples are things like twins, or a father and son sharing the same first name. These are known to cause problems in record linkage models, so it's important to know their impact.
We can use adversarial testing to help: where we deliberately construct record pairs that may be difficult for the model to classify correctly, and find out how the model performs in these cases.
In many ways, I believe these adversarial examples can be more valuable than accuracy metrics. They make it possible to explain to the end-user of the model the scenarios in which the model may fail, which helps with understanding the impact of failures. That is, if failures occur in specific scenarios, and not at random, then we can analyse the impact of these failures more effectively.
The adversarial examples are also very useful to the model development team, because it makes it much easier to identify mitigations or model improvements, and to test whether these mitigations work.
In this article I argue that labelling is a very valuable tool for measuring model performance, but for different reasons than typically thought. Another tool that is at least as important is adversarial testing. The end goal should not be considered to be raw accuracy metrics; instead, an understanding of the model's failure modes is just as important.
In the main text, I mentioned that I do not think that a "label a random sample of records" approach is the best way to measure accuracy.
Instead, I believe there is a more efficient way which yields deeper insights into the source of errors. This approach relies on grouping record pairs by their comparison vector - the specific pattern of matches and mismatches across columns.
To motivate this, let's consider an (unrealistically simple) example of a deduplication model applied to very high-quality data. Imagine our settings are as follows:
comparisons=[cl.ExactMatch("first_name"),cl.ExactMatch("surname"),cl.ExactMatch("dob"),cl.ExactMatch("city"),cl.ExactMatch("email"),],
In this model, every pair of records is evaluated against these five criteria, resulting in a vector of 1s (match) and 0s (non-match).
Since the data is high quality, a large fraction of the matches will naturally fall into the "everything matches" category. These pairs will have a comparison vector of [1, 1, 1, 1, 1].
If we take a random sample of likely matches to label, the vast majority will look exactly like this. There is almost no point in paying a human to verify these one by one. We probably want them to look at a single example, conclude that it is indeed a true match, and then effectively label every other comparison with the same comparison vector as a true match.
By grouping by the vector, we achieve a massive number of labels with very little effort. Moreover, we can qualitatively describe scenarios where the model is performing well.
We can take this logic further. Consider a scenario where the city doesn't match, but everything else does: [1, 1, 1, 0, 1].
We don't need a human to look at 500 examples of this. Instead, they can look at a handful of examples to understand the context. They might see that the city field often contains typos, or that people have moved house. They can then come to a view of whether that scenario, as a whole, represents a match (or assign it a specific probability).
In a realistic workflow using Splink, this approach amounts to using the Comparison Viewer dashboard (see also this video). You can look at the bar chart representing the frequency of comparison vectors, concentrate on the highest bars (the most frequently occurring patterns), and categorise whether these scenarios are likely matches or not.
The upshot of this approach is that you end up with qualitative as well as quantitative findings regarding the types of scenarios where you may end up with false positives and false negatives.
You can describe, via the comparison vector, the specific situations in which the model makes mistakes. For example, you might discover that "When email matches but date of birth differs, the model produces false positives because families share email addresses."
-
Arguably the labelling task should be assigning a probability rather than a binary label, since whilst these two records may in fact relate to the same person, if we observed another two records exactly like this, there's no guarantee they would also relate to the same person. ↩
-
The closest I've got to modelling this is measuring the covariance matrix in the pairwise comparison vectors, but it's not clear how you reconstruct synthetic source datasets from this. ↩